
Article 3 of 4 · The PMO and the Capital Project P&L
The Public Value P&L: Measuring Construction Cost Against What the Project Delivers
A government entity does not sell what it builds. Its revenue is what the project hands over: hospital beds and operating rooms, classrooms, kilometres of road, police stations, housing units, megawatts of data centre capacity, each to a defined quality. A government PMO that reports only budget spent tells the Ministry of Finance how much was paid, not what was delivered for it.
Parts 1 and 2 of this series looked at organisations that earn revenue from a contract or from sales. This article applies the same P&L discipline to government entities delivering capital projects: municipalities and ministries such as Finance, Health, Education, Interior and Defence.
What revenue means for a government entity
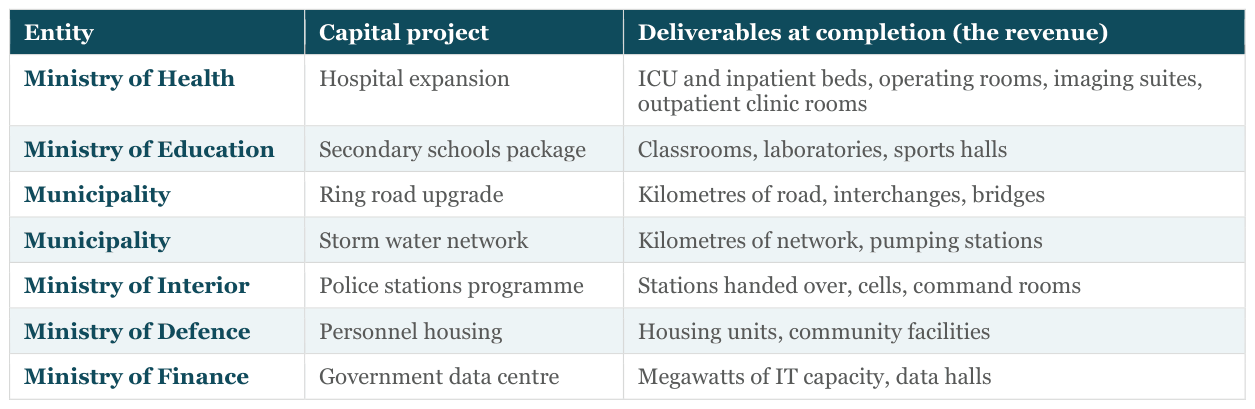
For a government capital project, revenue is the deliverables the project must hand over at completion, of the quantity and quality approved in the business case. A hospital expansion delivers a number of beds and operating rooms of a specified standard. A road project delivers kilometres of road. These are short-term, physical outputs, and they can be measured every month while the project is being delivered.
This is deliberately different from the long-term outcomes of the asset, such as reduced waiting times or lower congestion over the next twenty years. Those belong to the entity's Balanced Scorecard and strategic performance reporting. The P&L discussed here is narrower and more immediate: did the project deliver what it was funded to deliver, at the approved cost?

The Value P&L: crediting value when deliverables are accepted
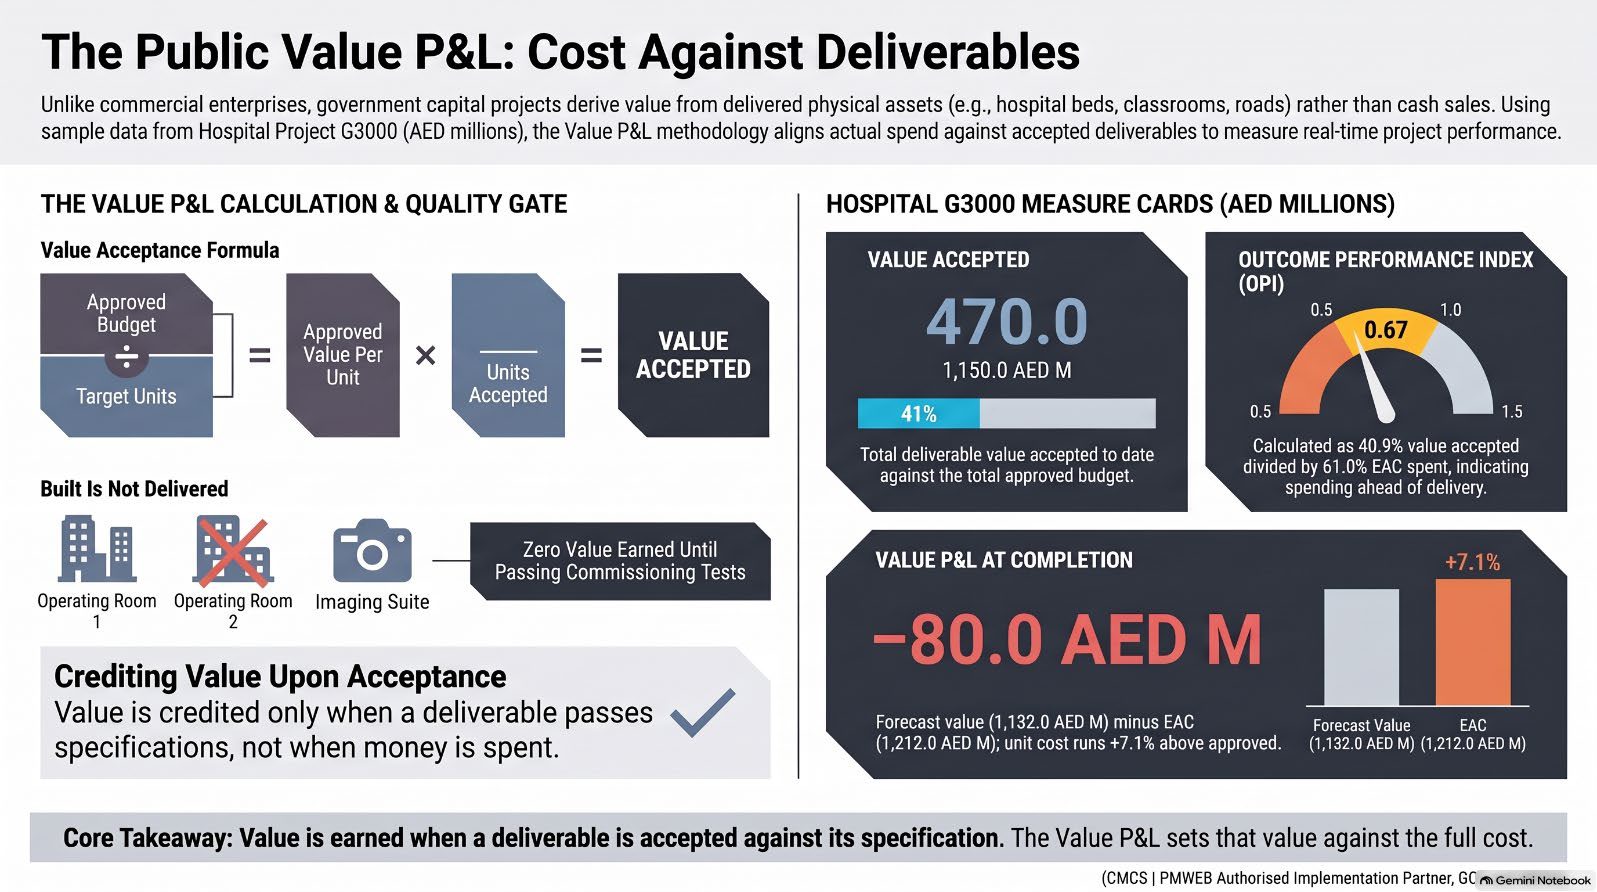
Without a selling price, the government PMO needs a value for each deliverable. The approved business case already provides one. The approved budget is allocated to each deliverable type, and dividing by the number of units gives an approved value per unit. On the sample hospital, the 1,150 million approved budget allocates 676 million to 260 inpatient beds (2.6 million per bed) and 192 million to 12 operating rooms (16 million per room).
Four measures follow:
• Value accepted: units handed over and accepted against their specification, multiplied by their approved value. A unit that is built but fails its commissioning tests earns nothing until it passes. • Value P&L at completion: the forecast value of deliverables at completion minus the Estimate at Completion (EAC). It turns negative when the project costs more than approved, or delivers less than approved, or both. • Outcome Performance Index (OPI): the percentage of deliverable value accepted divided by the percentage of EAC spent. Below 1.0, the project is spending ahead of what it delivers. • Cost per deliverable unit: the forecast cost of each bed, classroom or kilometre against the approved value. It is the figure the Ministry of Finance can compare across projects and entities. This is the public-sector equivalent of earned revenue. Value is credited when a deliverable is accepted, not when money is spent, and quality is part of the test.
Holding the deliverables in PMWEB
PMWEB holds the deliverables schedule as the project's revenue line. Each project carries its deliverable types, specification, target quantity, approved value per unit and planned handover dates, linked to the schedule milestones. Each handover is recorded as a deliverable acceptance record, configured as a PMWEB adaptive form with its workflow under the Delegation of Authority (DoA). It links to the evidence already held in PMWEB: inspection and test records, commissioning certificates, snag lists, and the end user's acceptance.
Because acceptance is a record, not a statement in a progress report, the PMO can show exactly how many beds or operating rooms have been accepted, how many are awaiting acceptance and why, and what value has been credited.
Deliverables schedule (PMWEB adaptive form) for the hospital project: G3000 (sample data)
Deliverable acceptance record (PMWEB adaptive form), Main tab: operating rooms 5 and 6 failed the pressure regime test
Workflow tab: the Delegation of Authority route, returned for re-test
Where the cost comes from: the PMWEB processes behind the P&L
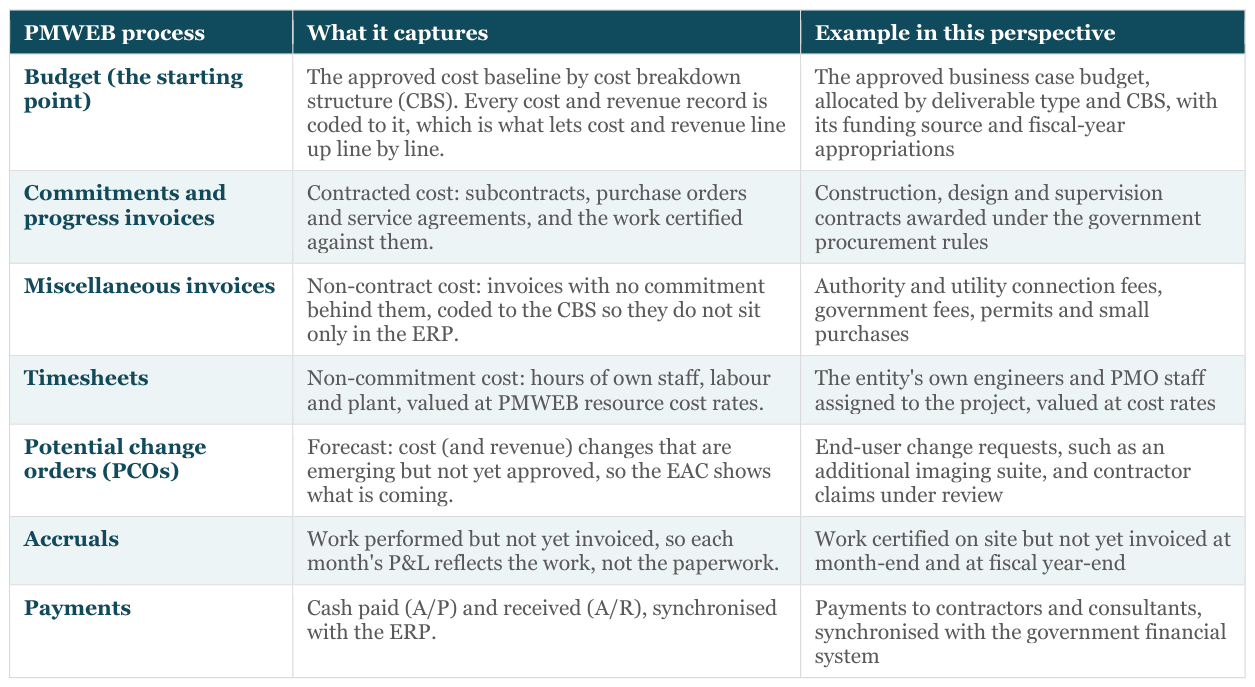
The cost side of the Value P&L is the full cost of delivering the deliverables, including cost that is often invisible in government reporting. PMWEB captures it through defined processes, starting from the budget:
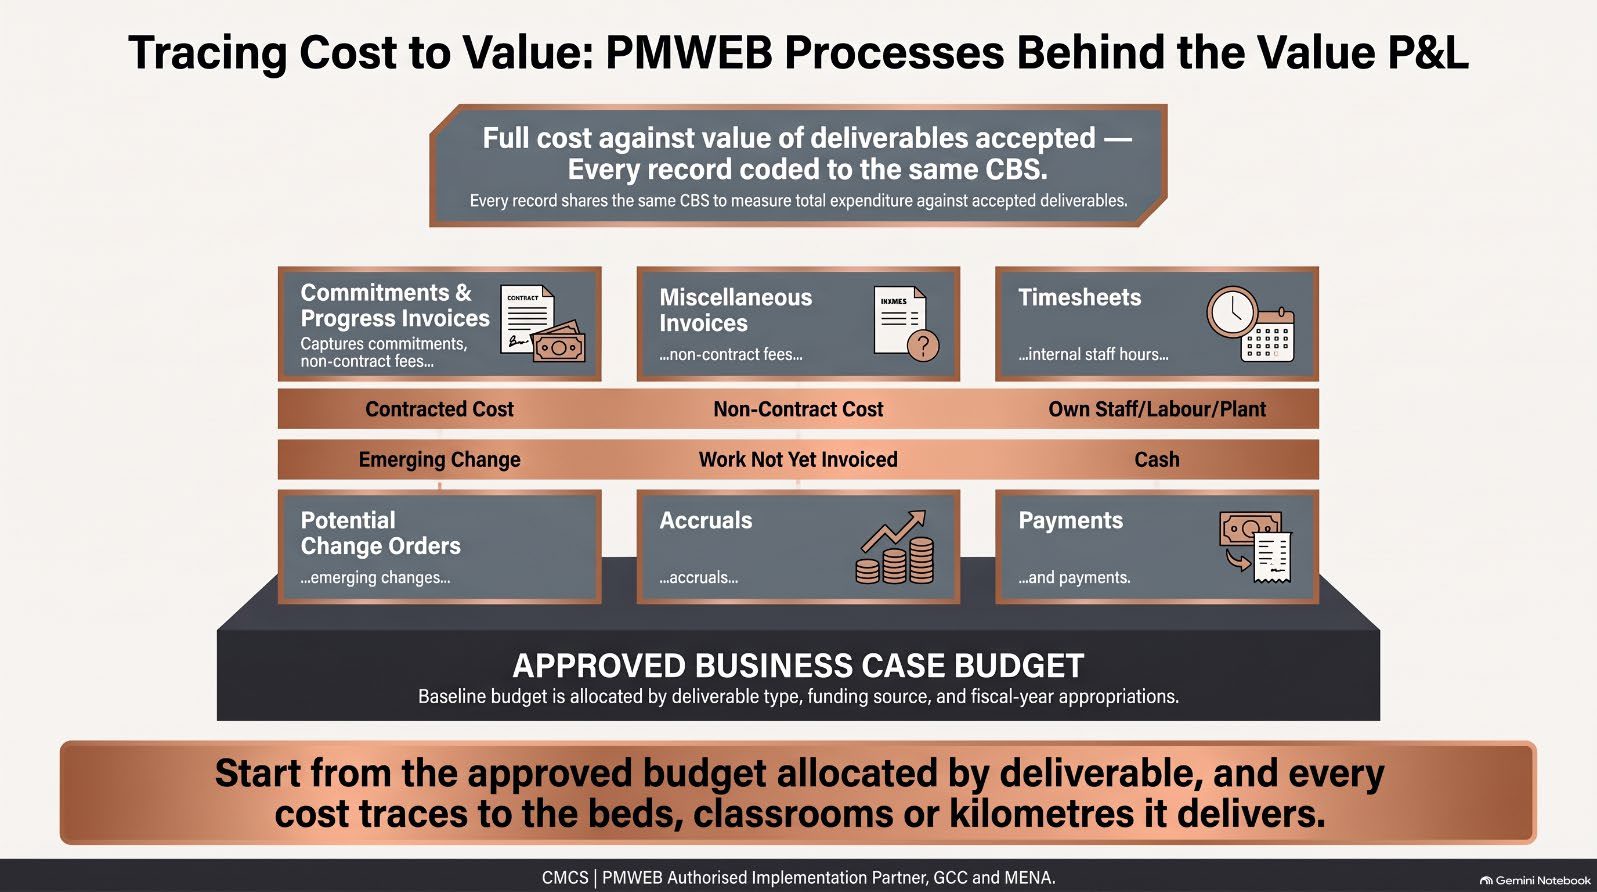
Starting from the approved budget allocated by deliverable means each cost can be traced to what it is delivering. That is what allows a cost per bed or per kilometre to be reported with confidence.
A real-time P&L: accruals ahead of the financial close
Many government financial systems record capital expenditure when it is paid. PMWEB accruals and certified invoices show the cost of work already in place, and PMWEB holds the deliverables value that no financial system records. For G3000:

The Ministry of Finance sees the true cost position and the value delivered today, not only the cash paid at the last close.
Potential change orders: claims, disputes and the P&L range
PCOs record contractor and consultant claims and disputes against the entity before they are settled, so the Value P&L shows their potential effect. For G3000:

Holding both sides in PMWEB lets the PMO report the P&L as a range, not a single number:

The range tells the entity how much additional appropriation it may need, and which disputes to resolve first.
The dashboard below is built in PMWEB's embedded Power BI reporting for a sample hospital expansion, with values in AED millions.
Project Value P&L dashboard in PMWEB: G3000, Hospital Expansion (sample data, AED millions)
• Spending is ahead of delivery. 61% of the EAC has been spent, but only 40.9% of the deliverable value has been accepted. The OPI is 0.67. • Beds are behind plan. 120 of 300 beds have been handed over against 160 planned. Inpatient beds are at 80 against a plan of 120. • Quality is holding back value. Two operating rooms and one imaging suite are built but awaiting acceptance after failed tests. Until they pass, they earn no value. • The project will cost more and deliver less. The EAC is 1,212.0 against an approved 1,150.0, driven by design changes, scope added by the end user, delay and escalation. One imaging suite has been deferred, so the forecast value at completion is 1,132.0. The Value P&L at completion is -80.0, or -7.0% of the approved budget. • Funding needs a decision. Commitments of 1,068.0 already exceed the 980.0 appropriated, so a further appropriation must be approved before new commitments are made.
At portfolio level, the Ministry of Finance or a central PMO can compare every project across entities, because each deliverable is valued in the same currency.
Capital Programme Value P&L dashboard in PMWEB: seven projects across six entities (sample data, AED millions)
• The programme will deliver 304.1 less value than it costs. Approved budgets total 5,847.0, the EAC is 6,133.1, and the forecast value of deliverables is 5,829.0. • Two projects explain most of the gap. The Ring Road Upgrade (-112.0) and Personnel Housing (- 92.5) account for 204.5, about 67% of it. • Personnel Housing has the weakest OPI. 25% of its housing units have been accepted for 47% of its cost spent (OPI 0.53). • Some projects deliver below approved unit cost. The Secondary Schools Package (+11.5) and the Storm Water Network (+7.7) are forecast to deliver their full scope for less than approved. • 5 of 7 projects are behind their deliverables plan, including the Government Data Centre, which has spent 41% of its EAC with no IT capacity accepted yet.
Reporting the government's capital programme
Beyond each entity, government leadership needs to report how the capital programme as a whole is moving: what has been delivered, what it has cost, and where intervention is needed. Because every project in PMWEB values its deliverables the same way, the Value P&L rolls up across entities. For the sample programme:

PMWEB 2026 AI on Value P&L data

Action is taken only with the user's approval, and PMWEB AI honours security settings, so each entity sees only its own projects unless the user's role covers the whole programme.
What the government PMO must put in place
• A deliverables schedule for every project, taken from the approved business case: types, specifications, quantities and approved value per unit. • Acceptance as a recorded event, with the test and commissioning evidence held in PMWEB. • The approved budget as the starting point, allocated by deliverable, so each cost traces to what it delivers. • All cost captured, including the entity's own staff time and non-contract fees. • A monthly Value P&L review in which each project shows value accepted, cost spent, OPI and Value P&L at completion, with an owner and action for every red item. • Long-term outcomes left to the Balanced Scorecard, so the P&L stays focused on what the project can deliver and the PMO can control.
Key takeaway
For a government entity, the revenue of a capital project is what it hands over at completion, in the quantity and quality approved. PMWEB values each accepted deliverable against the approved business case and sets it against the full cost, so the PMO can show what every dirham has delivered while there is still time to act.
Over to you: does your entity report capital projects by budget spent, or by the beds, classrooms and kilometres actually accepted for that spend?
Next in the series: Part 4, The Contractor: Progress Invoices and the Unbalanced-Bid Trap.

Next step
Bring this to your portfolio.
Tell us which processes matter most to you, and we will show them running in PMWEB.