
Article 11 of 12 · Digitalizing the PMO Mandate
The Control Tower: Where Project Data, Geography and the Site Converge
An entity delivering thirty, a hundred or three hundred capital projects concurrently faces a problem that no individual project team experiences. It has to know, at any moment, the true state of the whole.
Not a summary of the whole. The state of it — accurate enough to act on, current enough to matter, and detailed enough that a concern raised at portfolio level can be pursued to the specific record that caused it.
This is what a control tower is. It is not a room with screens, although it often has one. It is the capability to observe a portfolio continuously, in a way that connects three normally separate kinds of knowledge: what the records say, where things are, and what is physically happening on the ground.
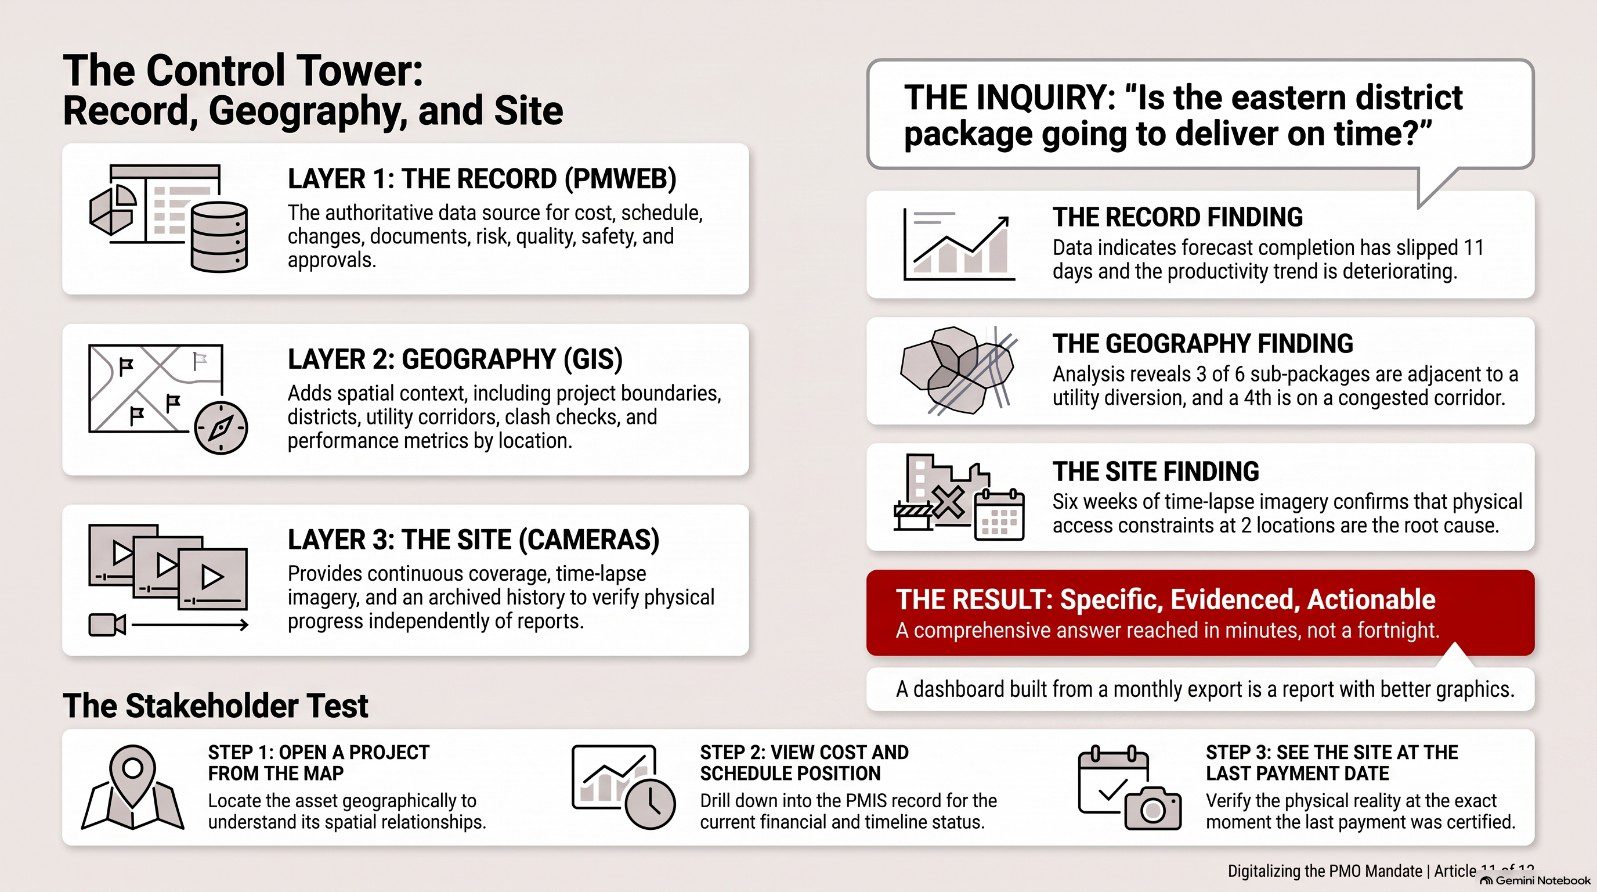
Layer one: the record
Everything in the previous nine articles constitutes this layer. Budget and commitment. Schedule and progress. Changes, claims and contractual exposure. Documents, submittals and RFIs. Risk, quality, safety and compliance. Approval performance and open actions.
Held in a PMIS, this layer answers the question what do our records say is happening. It is authoritative, complete, current and traceable, and for most management purposes it is sufficient.
It has one limitation. It describes the portfolio as a list. A hundred projects presented as rows in a table, however well- instrumented, do not convey the relationships between them — and for infrastructure, municipal, transport and development programmes, many of the most important relationships are spatial.
Layer two: geography
Capital projects occupy space. They have boundaries. They affect the land around them. They interact with other projects, with existing assets, with utilities, with transport networks and with the communities that live alongside them.
A geographic information system holds this. When PMWEB project data is associated with GIS, the portfolio becomes viewable as a map rather than as a list, and a set of questions becomes answerable that were previously extremely difficult.
Which projects are located within a district, and what is their combined status. Do the boundaries of two projects overlap or conflict. Which projects are affected by a planned utility corridor. What is the concentration of works in an area, and what is the cumulative disruption to residents. Which projects sit on a route that must remain operational during a specific period. Where are the assets we already own in relation to the assets we are building.
The mechanism is straightforward. Projects in PMWEB carry positional attributes — longitude, latitude and elevation — which provide the basis for associating project records with spatial features in an enterprise GIS. Integration between the two is delivered through APIs scoped to the specific use cases the entity needs, which keeps the integration proportionate rather than open-ended.
CMCS has delivered this combination in production. For a Saudi municipal client, we implemented PMWEB with Primavera P6 and ESRI GIS in a fully Arabic-language interface, providing project boundary geometry capture and editing, intersection and clash checking performed by drawing directly on the map, Shapefile and KML/KMZ import, an approval workflow operating on geospatial boundaries and details, and performance indicators for quality, health and safety, actual progress and financial progress rendered by department, by consultant and by contractor.
That last capability is worth pausing on. Performance indicators rendered spatially answer a question that no table answers: is our delivery performance geographically uneven, and if so, where and why. For a municipality, a development authority or a national programme, that is a governance question of the first order.
Layer three: the site
The third layer addresses the residual weakness of any record-based system, which I raised in the article on real-time reporting.
A record reflects what someone entered. It is only as current and as accurate as the process that produced it. The entity managing by records alone is managing a representation of the project, and the representation can be wrong — through delay, through error, or occasionally through optimism.
Construction site cameras close this gap. Fixed cameras providing continuous coverage of a work area, with time-lapse capture and archived history, give an entity direct observation of physical progress that is independent of what anyone has reported.
The value is not in watching. Nobody has time to watch. The value is in the ability to verify a specific assertion at a specific moment.
A contractor claims a structure was complete at the end of the month. The camera archive for that date settles the question in thirty seconds. A delay is attributed to weather on specific days. The archive shows conditions on those days. A claim asserts that access was obstructed for three weeks. The archive shows the access. A progress payment is certified against installed quantities. The imagery is available alongside the certification record.
When camera feeds and archives are linked to the project record in PMWEB, verification becomes part of the transaction rather than a separate investigation. The certifier reviewing a payment application can look at the site as it was on the date claimed. The reviewer assessing a delay notice can look at the conditions described.
This changes contractor behaviour before it changes anything else. Assertions that will be checked against imagery are made more carefully.
What the three layers produce together
Take a single question and follow it through all three layers, because that is where the argument lands.
Is the eastern district package going to deliver on time?
The record layer shows the schedule position, the progress trend, the open change exposure, the approval backlog and the risk register. It says the forecast completion has slipped eleven days and the productivity trend is deteriorating.
The geographic layer shows that three of the six sub-packages in that district are adjacent to a utility diversion scheduled for the same period, and that a fourth sits on a corridor already congested with two other programmes' works. The productivity deterioration has a spatial explanation that no individual project team could see.
The site layer shows the actual condition of the work areas over the past six weeks, confirming that access constraints in two locations are real and not merely asserted.
Three layers, one question, an answer that is specific, evidenced and actionable — reached in minutes rather than in a fortnight of investigation.
That is the control tower. It is not a technology purchase. It is the accumulated consequence of having built the record layer properly, which is why every article in this series before this one was necessary.
For the stakeholder
Entities across the Kingdom are describing control towers in their strategy documents. It is worth knowing how to distinguish one that exists from one that is planned.
Ask to see the portfolio on a map, and ask to open a project from it. Ask to see the same project's cost and schedule position. Ask to see the site on the date of the last certified payment.
Next in the series: the closing article — from option to obligation, and what an entity should do in the next one hundred and eighty days.

Next step
Bring this to your portfolio.
Tell us which processes matter most to you, and we will show them running in PMWEB.